Power Query & Power Pivot In Excel For Corporates
Excel BI is a powerful, flexible tool for every analytics activity. It gives you broad data analytics and visualization capabilities.
It consists of : Power Query, Power Pivot, DAX.
Can you Create a Pivot Table of This DATA? on the basis of Month, under Rows?

Download this file & Try to get desired results from the given DATA
If you have any Queries Talk to the Trainer : +91-9819006132
Want To Know More About The Course
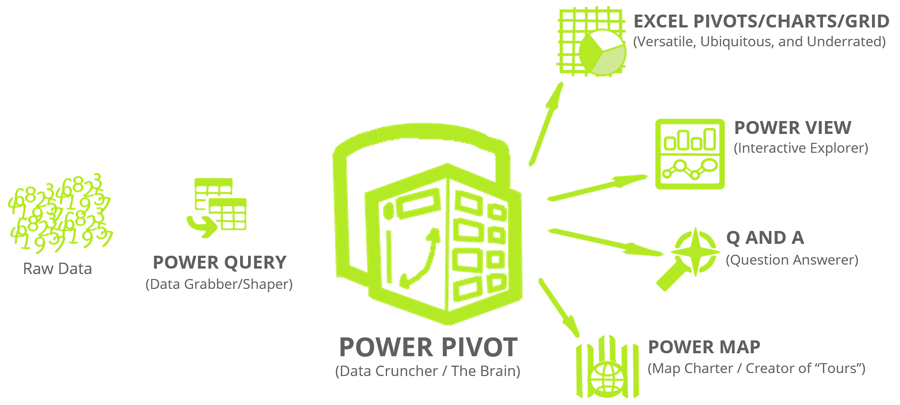
What Is EXCEL BI :
Power Query is a tool that can be used for data discovery, reshaping the data and combining data ( Merge / Blend / Consolidate, etc.) coming from different sources.
Power Query can connect directly to Excel, Access, Text, CSV, Hadoop, Sales Force, Azure and many other different sources of data.
Power Pivot is an Excel add-in which can be used to perform powerful data analysis and create sophisticated data models.
Power Pivot can handle large volumes of data (millions of rows) from various sources and all of this within a single Excel file.