Power Pivot & DAX Courses In Mumbai
About Power Pivot
Power Pivot is a feature of Microsoft Excel that was introduced as an add-in to Excel 2010 and 2013, and is now a native feature for Excel 2016 and 365. As Microsoft explains, Power Pivot for Excel "enables you to import millions of rows of data from multiple data sources into a single Excel workbook, create relationships between heterogeneous data, create calculated columns and measures using formulas, build PivotTables and PivotCharts, and then further analyse the data so that you can make timely business decisions without requiring IT assistance."
The most important and powerful feature of Power Pivot is its database − Data Model. The next significant feature is the xVelocity in-memory analytics engine that makes it possible to work on large multiple databases in a matter of few minutes.
Loading Data from External Sources
You can load data into Data Model from external sources in two ways −
(1) Load data into Excel and then create a Power Pivot Data Model.
(2) Load data directly into Power Pivot Data Model.
The second way is more efficient because of the efficient way Power Pivot handles the data in memory.
Power Pivot Data Model uses xVelocity storage, which is highly compressed when data is loaded into memory that makes it possible to store hundreds of millions of rows in memory.
Thus, if you load data directly into Data Model, you will be doing it in the efficient highly compressed form
For clarity, the key benefits of using Power Pivot vs. basic Excel can be summarised as the following:
It lets you import and manipulate hundreds of millions of rows of data where Excel has a hard constraint of just over a million rows.
It allows you to import data from multiple sources into one single source workbook without having to create multiple source sheets that suffer from version control and transferability issues.
It lets you manipulate the imported data, analyze it, and draw conclusions without slowing down your computer to a snail’s pace.
It lets you visualize the data with PivotCharts and Power BI.
Learn DAX : Data Analysis Expression
DAX is a Formula language written to a Pivot table.
DAX, has more than 200 function and counting. The rich DAX formula language includes libraries of incredible capabilities to perform computational gymnastics on your data and create powerful analytical data models.
DAX Language
The strength of Power Pivot comes from the DAX Language that can be used effectively on the Data Model to perform calculations on the data in the data tables. You can have Calculated Columns and Calculated Fields ( Measures )defined by DAX that can be used in the Power PivotTables and Power PivotCharts.
We start right from the Basics of DAX, understanding FILTER CONTEXT, CURRENT ROW CONTEXT, CONTEXT Transition, ALL, FILTER, RELATEDTABLE, CALCULATE, EARLIER, Relationships and much more.
How to Evaluate a DAX statement under different scenario's, depending on your Data Model.
In the last phase of this course, you will learn about Time Intelligence and Date Tables. We will look at expressions such as TOTALYTD, SAMEPERIODLASTYEAR, DATESADD, DATESBETWEEN, CALENDERAUTO, and we will explore how many of these functions work using CALCULATE
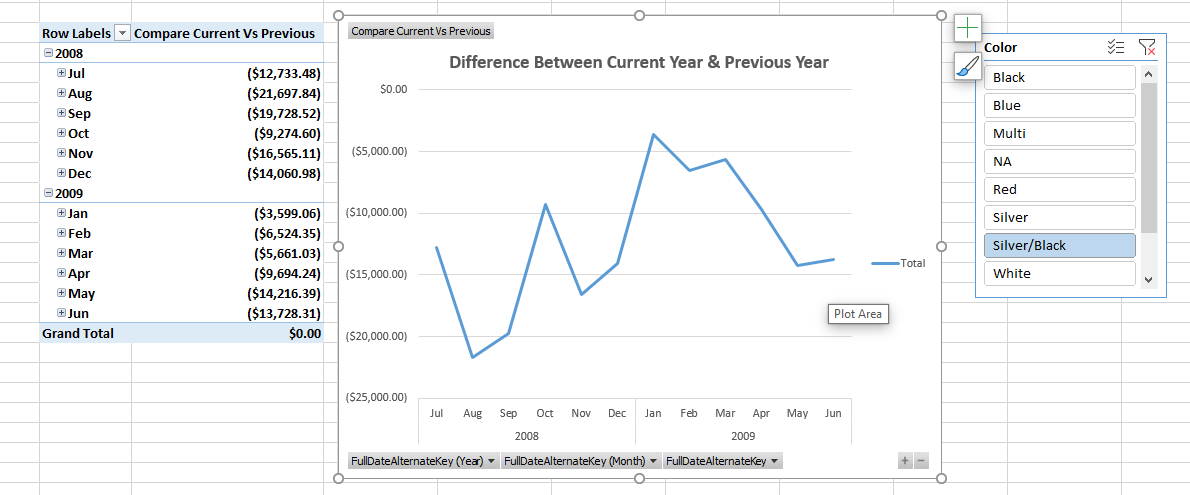
Let’s take an example: Calculating the Sales for a Given Year, and to compare it with the Previous Year, on the basis of a Slicer.
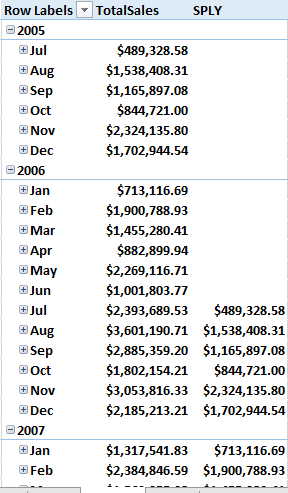
(1) SalesAmount for a Given Year
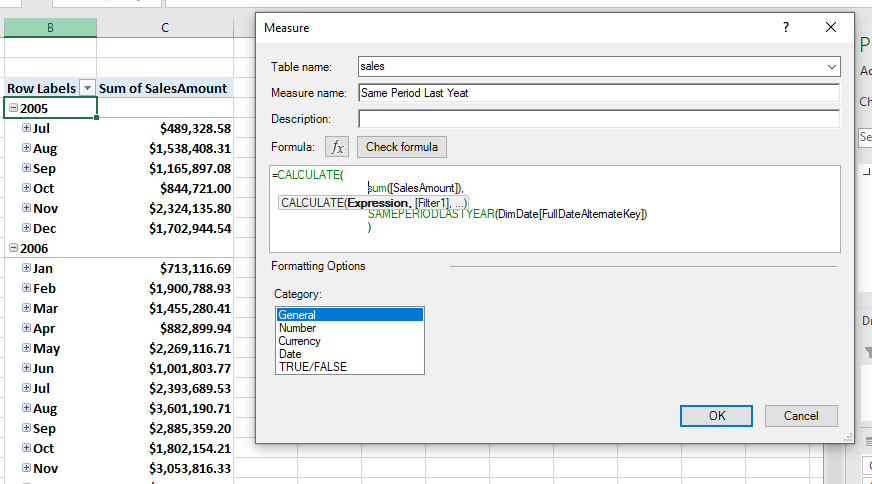
(2) SalesAmount for a Previous Year
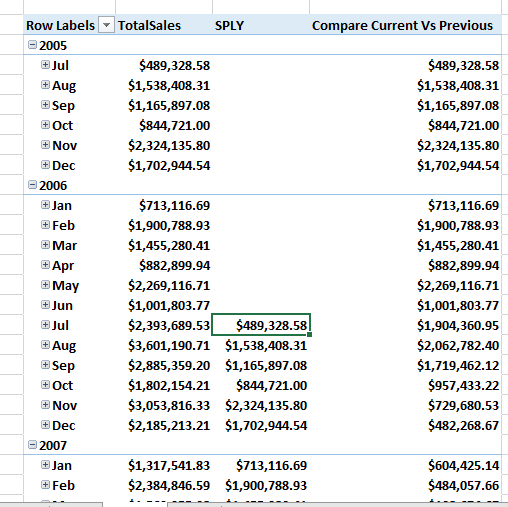
(3) Finding Difference Between SalesAmount for Current Year & Previous Year
(4) Visualizing SalesAmount Difference Between Current Year & Previous Year
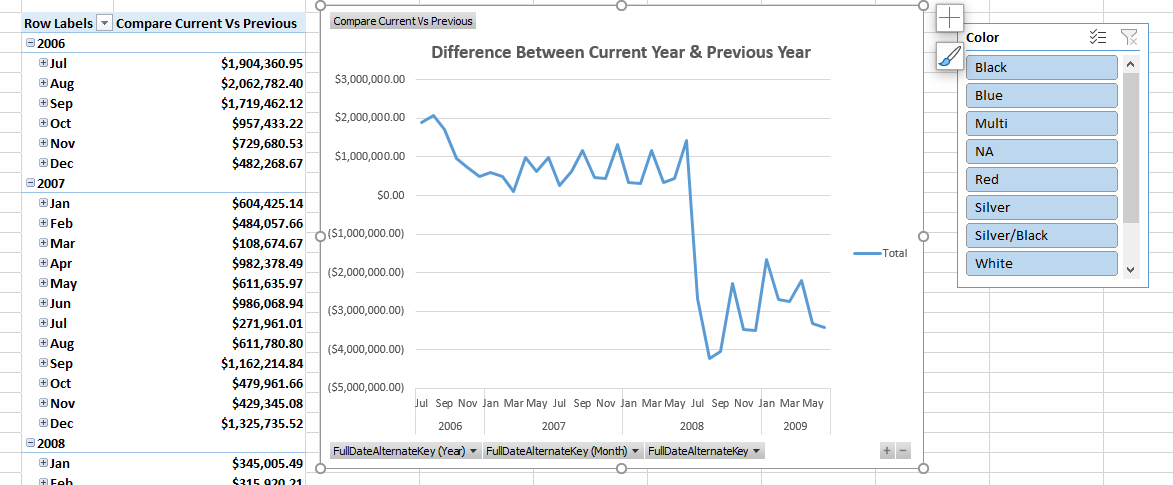
(5) Visualizing SalesAmount Difference Between Current & Previous Year By Color